Cash flow in and out diagram.
The difference between the cash flow in and out diagram.
The cash inflows are the sources of cash as receipts, revenues, Incomes, and savings generated by project and business activity.

The inflows are represented by a plus or positive sign(+), which is why it is called cash inflows.
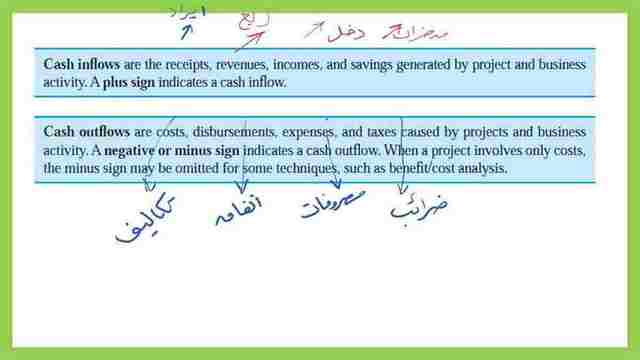

While cash outflows are the sources for cash out such as costs. An amount that has to be paid, or spent to buy or obtain something. While disbursements are the payments from a loan, expenses are the costs required for something.
A compulsory contribution to state revenue.
The cash outflows are the sources for cash out such as costs, An amount that has to be paid, or spent to buy or obtain something. While disbursements are the payments from a loan, expenses are the costs required for something or taxes which is a compulsory contribution to state revenue.
Cash outflows are caused by projects and business activities. The outflows are represented by a negative sign( -) indicates Cash Outflows.
When a project involves only costs, the minus sign may be omitted for some techniques such as benefit /cost analysis.
An example of a cash flow in and out diagram.
This is an example of a cash flow in and out diagram, for 5 years, the X-axis represents the time scale. The axis is divided into 5 equal spaces from 0 to 5.
The interval from 0 to 1 represents the first year period, from 1 to 2 represents the second year, from 2 to 3 represents the third year from 3 to 4 represents the fourth year, and from 4 to 5 represents the fifth year.
What matters is the cash flow is the plus sign (+) for cash in and the minus sign (-) for the cash out this is shown in the vertical axis. At time t=0 is the present and t=1 is at the end of the period after one year. We assume that the periods are in years for now.
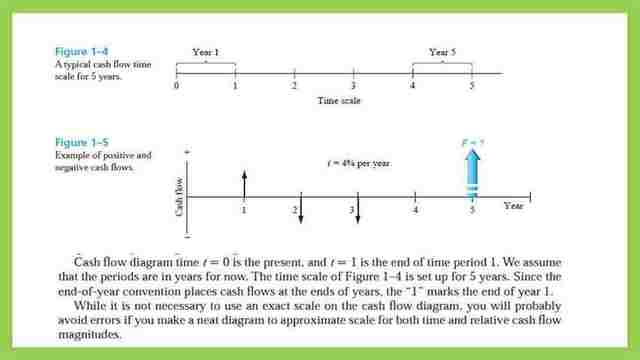

The time scale is set for 5 years, since the end of the year, the convention places cash flows at the end of a year, the “1” marks the end of year 1, as shown in this cash flow at the end of the first year there is money received represented by an upward arrow.
At the end of the second year, payment is done or cash-out or outflows or expenses and there is an arrow pointing downwards.
At the end of the third year, there are expenses as well represented by an arrow pointing downwards, it is expected to have cash-in at the end of the fifth year for which the income is unknown.
There is an example, you borrowed $8500 at time=0, first, we draw the scale, but check the scale units for cash flow in and out of the diagram and the total time duration, we have time in weeks, we have time 0 and two times intervals 1 and 2, the x-axis title is written weeks.
The income is represented by the(+) sign and the expenses or outflows by the minus(-) sign.
You borrowed $8500 at time t=0, the borrowed money is considered as cash-in, and an upward arrow is drawn at t=0 or now, after one week or t=1, he bought a carby $8000, which is expressed as -$8000, since it is cash-out and is drawn with a downward arrow.
A paint job is done at t=2, its expenses=$500, a negative sign is placed since this is an expense, and a downward arrow is drawn at t=2, the arrow is drawn with a small scale to represent the $500, that was the sketch from borrower point of view.
For the different perspectives, the value and time are shown as follows, In the case of the bank, a loan was given $8500, which will be represented by the (-) sign in the bank cash-in and cash-out diagram.
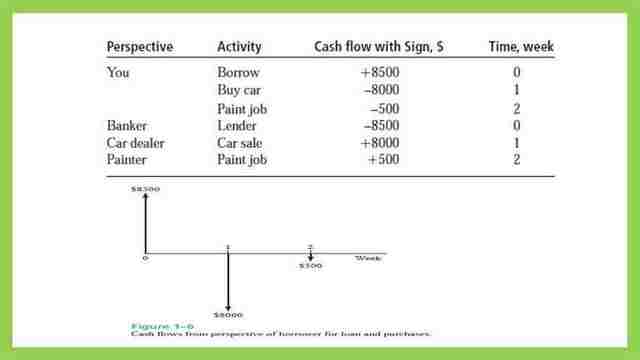

. The car dealer cash-in and cash-out, has an income of $8000, after selling a car, which is cash-in at t=1, this income will have a (+) sign.
For the painter, cash-in, and cash-out, he received $500, as cash-in will be an income or inflows, and has a(+) sign at t=2.
A solved example 1.10 for Cash flow in and out diagram.
This is an example from Prof. Anthony Tarquin’s book, Engineering Economy, how to draw a cash flow in and out diagram.
Example 1.10- An electrical engineer wants to deposit an amount P now such that she can withdraw an equal the annual amount of A1 $2000 per year for the first 5 years, starting 1 year after the deposit, and a different annual withdrawal of A2 $3000 per year for the following 3 years. How would the cash-flow diagram appear if i =8.5% per year?
The solution can be done through these steps:
1- Draw a timeline and divide it into 8 equal intervals.
2-She deposited at t=0 is represented by a(-) sign since she withdraws money from the other resource. For the cash flow in and out diagram, the Present value of P is to be estimated and is represented by a downward arrow, it is called P. 3.
She can withdraw an equal annual A1=$2000 for the next 5 years, we draw an equal five arrows at t=1, t=2, t=3, t=4, and at t=5 at the x-axis for time intervals in years
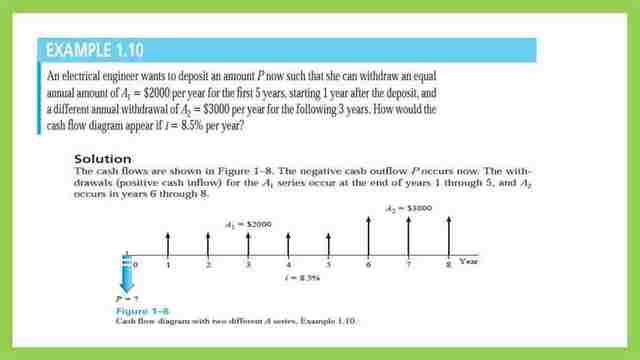

The arrows are drawn as upward arrows.
4-She can withdraw A2=$3000, which are drawn as an equal arrow at t=6, t=7, and t=8.
Each arrow is an income and is drawn in the (+) direction in the cash flow in and out diagram at the x-axis for time intervals in years, the arrows are drawn as upward arrows, and the arrow height for the last three years is longer as compared to the arrows for A1 since the A2 value is larger. The Cashflow in and out diagram is completed.
Terminology and symbols.
The equations and procedure of the engineering economy utilize the following terms and symbols, to make these symbols unique and universal, Sample units are:
P: The value of the amount of money at the time designated at the present or time 0.
F: the value of money or amount of money at some future time.
Also, F is called the future worth, or future value(FV) in dollars.
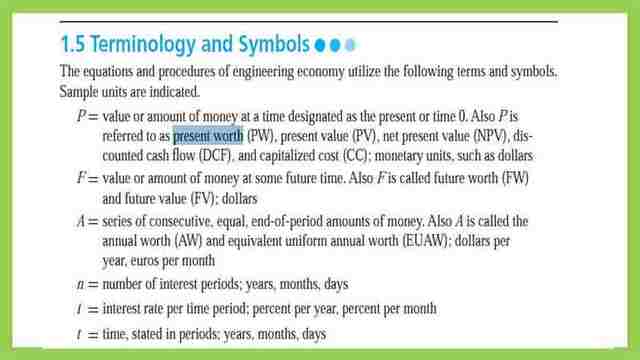

A is a Series of Consecutive, equal, and end of period amounts of money and also is called the Annual worth (AW) or equivalent uniform annual worth (EUAW). n : number of interest periods, months, days.

I : interest rate per period; per year, assumed per year unless otherwise mentioned else, or percent per month. t: time, stated in periods; years, months, days.
Economical factors.
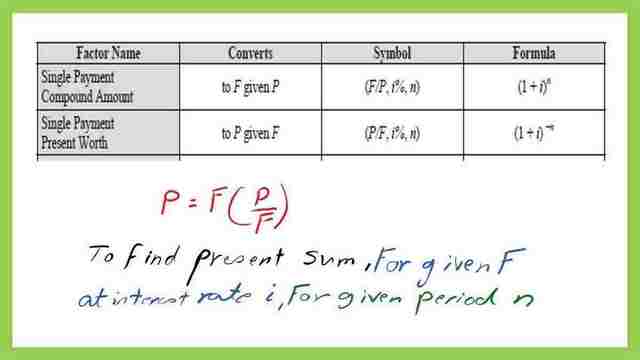
As if creating an equation, if we need F, then equate to P(F/P), where P is given the numerator P and denominator P will cancel each other.
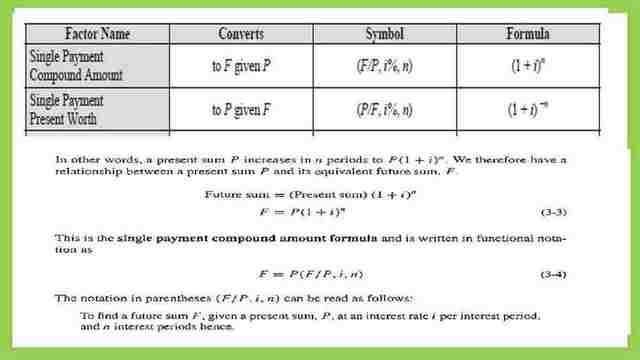

Then, F on the left-hand side and F on the right-hand side.
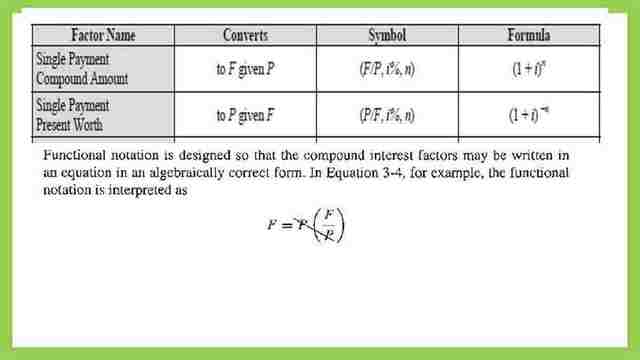

But, if we want the P, the present value as a function of given F, then this can be expressed as P=F(P/F), if the F value is given, also i% and n are given.
This is the PDF file used in the illustration of this post.
For a useful external resource, Engineering Economy, click the link: Applying Theory to Practice.
This is a link to the next post, What is MARR?

