The difference between simple and compound interest part 2.
Time value of money part-I- from Prof Pamela Peterson.
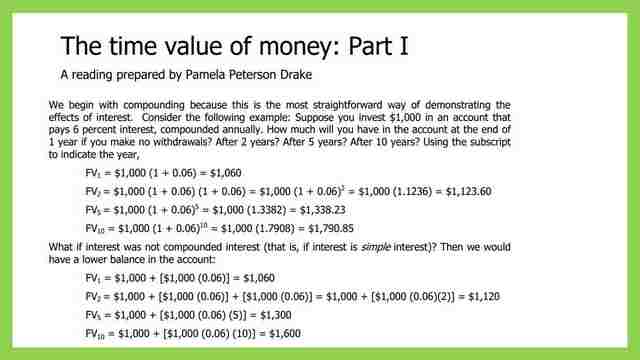
This is our new post for compound interest part 2, for which I have included an extract from Prof. Pamela Peterson Drake’s reference link, in which she has introduced an example for an investment of $1000 in an account that gives 6% per year as compound interest.

How to estimate the simple interest of investment.
She also included another case for the interest rate to a simple of 6% and determined the corresponding future values of the same deposit after the same period of time.
For each future value, change the n value, to get the corresponding future values.
Since there is no function to estimate the future value after several years.
The reference cells are used to estimate the values as we can see from the slide image.
We have the present value of $1000, while the interest value is 6%, creating an equation of Future value at time t=Present value(1+i%n).
The present value is placed at cell $D$4, a referential cell. The simple interest rate i% is placed at cell $h$4, n is the time, for which a column is placed starting from t=0 to t=10 from c4 to c14. Please refer to the table in the next slide image.
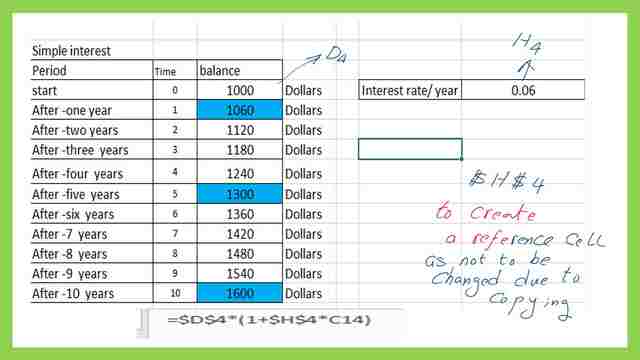

The equation can be written as D5=$D$4*(1+$h$4*(c3)). Or the future value after one year=present value*(1+i%*1)=1000*(1+0.06*1)=1060.
The equation can be written as D5=$D$4(1+$h$4(c3)). Or the future value after one year=present value(1+i%1)=1000(1+0.061)=1060. While for n=3, the future value for a simple interest of 6% will be=1000*
(1+0.06*3)=1180.
How to estimate the compound interest of the investment?-first method.
For the compound interest part 2. To estimate the future value for investment with compound interest. We can prepare columns for the time starting from 0 to 10, which is represented by column h starting from H5 to H15.
For the future value, I used column I from i5 to i15. the present value I put as H5=1000. the interest value as F5=6% in our example.
The future value after one year can be written =$I$5*((1+$F$5)^H6). The future value after one year can be written =$I$5((1+$F$5)^H6). The future value after two years can be written ==$I$5((1+$F$5)^H7).
The future value of $1000, with 6% compounded yearly=1000(1+0.061)=1060, this
value is the future value after one year.
The future value after two years=1000(1+0.06)^2=1123.60. The future value after five years=1000(1+0.06)^5=1338.23.
The future value after 10 years=1000*(1+0.06)^10=1790.85. Please refer to the right-side table in the next slide image.
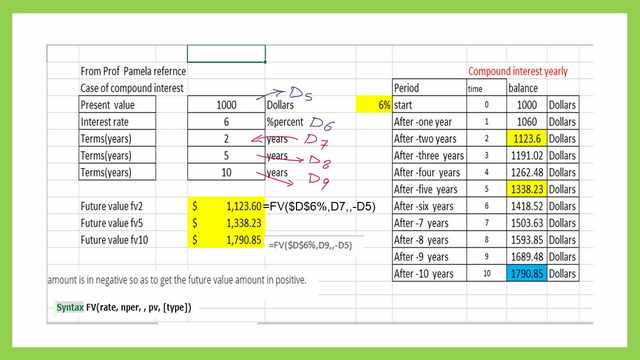


This is the assigned function for the compound interest estimation, as we can see in the
next slide image, we have FV(rate, nper, PV,(type)) from which we can estimate the compound interest.
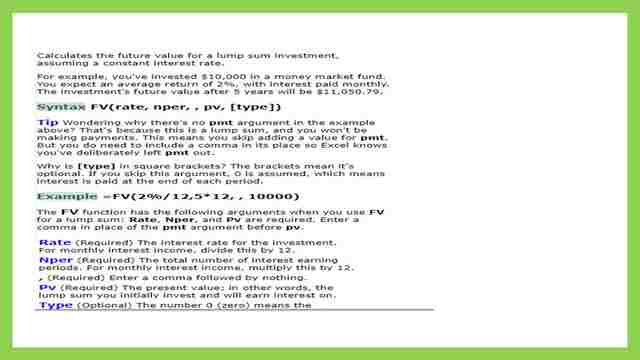

How to estimate the compound interest of investment-excel built-in function.
I have prepared an Excel sheet for which I have listed the following:
1-present value =D5=1000.The interest value=D6=6%. Terms by years-2 years=D7=2.
Terms by years-2 years=D8=5. Terms by years-2 years=D9=10.
We will apply to get the future values after 2,5,10 years and compare these values with the values we have previously obtained.
To use the built-in Excel formula Please refer to the Excel sheet. Fv after 2 years=FV($D$6%,D7,,-D5).
Fv after five years=FV($D$6%,D8,,-D5).
Fv after ten years=FV($D$6%,D9,,-D5). the values matched the future values estimated earlier.


This is a list of the terms used to estimate the Future values and present value for investment.
PW is the present worth.
Pv is the present value.
F is the future value.
A is a series of consecutive.
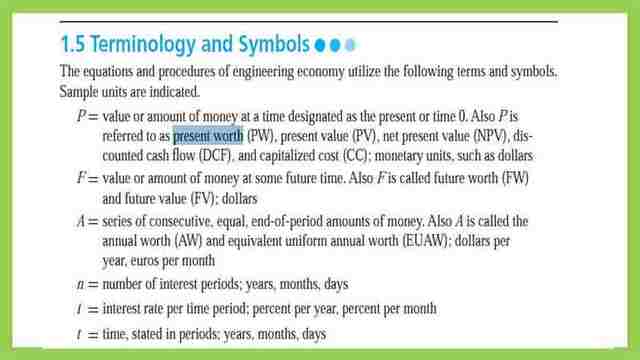

This is the PDF file used in the illustration of this post.
The next post title is the Cash flow in and out diagram.
Engineering Economy Applying Theory to Practice is a good reference.

