Last Updated on January 27, 2026 by Maged kamel
Introduction to Macaulay’s function and Singularity functions.
Macaulay’s function and the singularity function are essential concepts in mathematical analysis. Macaulay’s function is a mathematical tool that defines a piecewise polynomial function by combining polynomials of different degrees. On the other hand, the singularity function is a mathematical function commonly used to represent concentrated loads or forces in structural engineering. These functions play crucial roles in various areas of mathematics and engineering.
This is a link to the video I have prepared for this introduction.
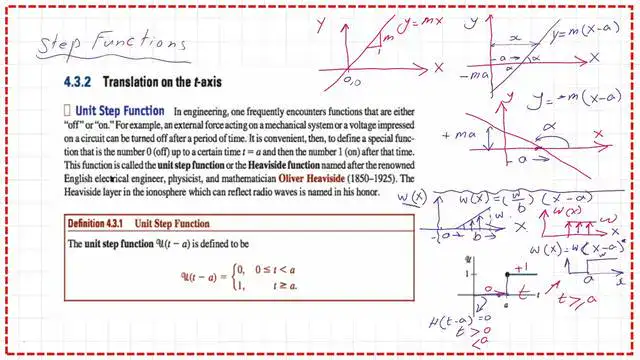
What is a step function?
There is a function called the unit step function, or Heavisine function, that starts at a certain time when we plot t on the x-axis and the Heavisine function on the Y-axis.
We can express the relation as H(t-a) = 0 for t < a and 1 for t >= a. It forms a step shape with an equal riser, which is extended for T > a.
The upper part of the slide shows a familiar line graph. When a line of positive slope m passes through the origin (0, 0), its equation can be expressed as y = mx.
If the same line was shifted by a distance a from the y-axis and maintained the same slope m, then y is expressed as y=m(x-a). But when the line is shifted by a distance a- from the y-axis and maintains a negative slope (-m), the equation can be expressed as y=-m(x-a).
We will utilise this expression later when dealing with a triangular load. But the y-axis will be w(x), and the load expression is written as w(x)=+w/b(x-a), where the base is the load base, and w is the ordinate load intensity.
The line can express a uniform load starting from a distance (a) from the left edge and extending to the end of the beam. Its equation will be W(x)=w(x-a)^0, where w is the intensity of the uniform load. We use the expression w(x-a)^0 to indicate that the load at x<a is considered zero, whereas for x>a, it equals w.
Represent the shear function for a beam as a group of step functions.
In the next slide, if we have a beam of length L with two supports and a concentrated load at a distance a from the left support, the remaining distance to the right support is b.
We estimate that the reaction at the left support will equal (P*(b)/L. Meanwhile, the reaction at the right support will be equal to P*(a)/L.
To express the shear function, we can consider the previous beam as an assembly of three-step functions. The first case is the shear due to the left reaction force, expressed as Q(x) = +P*b/L, modelled as a step function with a rise equal to P*b/L extending to the end of the beam.
To express the load P as a shear function, it acts as a step function starting at distance a, with a rise of -P and extending over a distance (L-a). Finally, the correct support reaction, with a value of P*(a/L), is a step function starting at x = l with a shear value of -Pa/L. The previous shapes can be combined to form the shear diagram as shown.
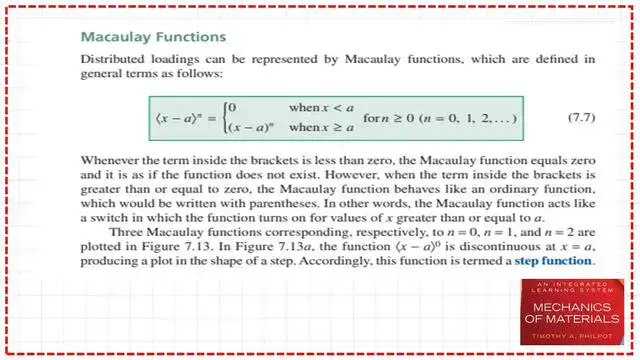
In the next slide, I quote from Prof. Timothy Philpot’s book, An Integrated Learning System. Macaulay’s functions represent quantities that begin at point a.
Before point a, the function is zero.
After point a, the function has a value of f(x-a)^n, since it is a distance a. Macaulay’s function is expressed not in parentheses but with a different form, smaller than and bigger than signs or bracketed terms. The function value is 0 when x is smaller than a and (x-a)^n for x> or equal to a.
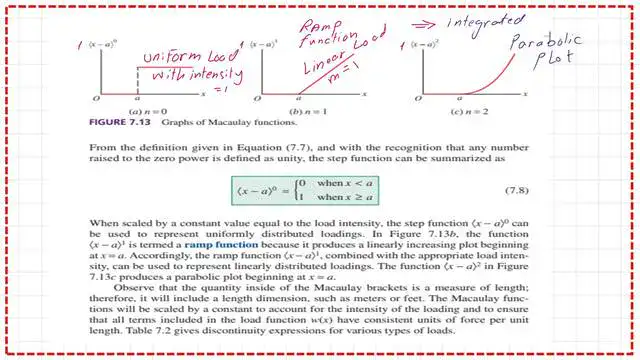
Macaulay’s function with different n values.
In the next slide, Macaulay’s function is evaluated at three values of n: 0, 1, and 2. When n=0, the function is a straight line, and the y value is (x-a)^0=1 when x=a or bigger than a and zero for x<a. That expresses a uniform load.
Macaulay function when n=1, the function is expressed as an inclined line, and the y value is (x-a)^1=1 when x=a or bigger than a and zero for x<a.
This function is a ramp function that expresses a linear load. The last form is when n=2, where < x-a>^2 yields a parabolic plot. The parabolic plot can be used to explain the moment values of distributed loads acting on a beam.
Introduction to singularity functions.
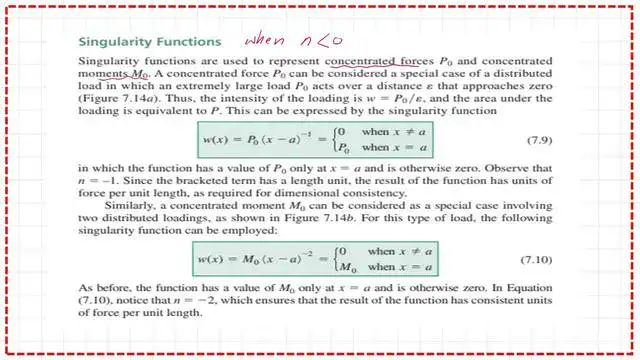
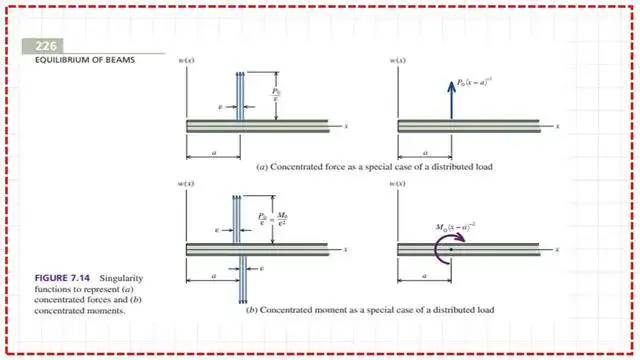
The next slide shows new singularity functions with n = -1 or -2. These singularity functions can be used to express concentrated loads and moments.
These functions can give the value of the load intensity in case of a concentrated load P0 acting as w(x) as =P0*<x-a>^-1 as equal 0 when x does not equal a and equals P0 when x=a, in that case n=-1.
In the case of a concentrated Moment M0 acting, the load function expressed as w(x) =M0*<x-a>^-2 equals 0 when x does not equal a and equals M0 when x=a. The n value equals =-2 in this case.
The first graph shows the relations between W(x) and P0*<x-a>^-1 function shifted by a distance a. While the second graph shows the relations between W(x) and M0*<x-a>^-2 function shifted by a distance a.
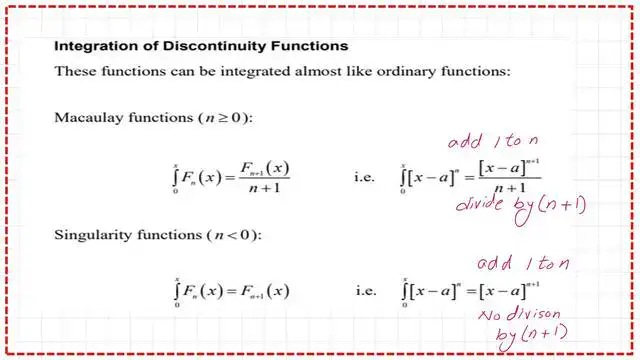
The difference between the integration of Macaulay’s function and the integration of the singularity functions.
In the case of Macaulay functions, where n >0, after integration, we add 1 to n and divide by (n+1), the same as any ordinary function. In the case of singularity functions. Where n<0, after integration, we add 1 to n, and there is no division by (n+1).
The difference of the integration between Macaulay’s function and discontinuity functions.
You can download the content of this post in PDF format from the document below.
This is an introductory link to Macaulay’s function in WIKIPEDIA.
This is a link to my “
DEFLECTION – Macaulay’s Method (Double Integration) – Made Easy! (Strength Of Materials Series – Module #2 Book 1)-Amazon.
