Last Updated on January 13, 2026 by Maged kamel
Definition of interpolation and linear interpolation?
As defined by Prof. Gilat Amos, reference book, Numerical Methods for Engineers and Scientists, 3rd Edition: An Introduction with Applications Using MATLAB, Interpolation is a procedure in which a mathematical formula is used to represent a given set of data points such that the formula gives the exact value at all the data points and an estimated value between the points.
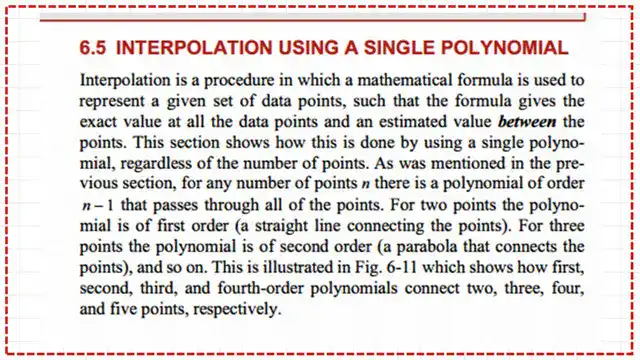
This section shows how to do this using a single polynomial, regardless of the number of points. As mentioned in the previous section, for any number of points n, there is a polynomial of order n—1 that passes through all points.
The polynomial of the first order (a straight line connecting the points) for two points.
For three points, the polynomial is of second order (a parabola that connects the points), and so on. The following slide image shows the same function, represented by different polynomials based on the information from the given points.
For instance, if only two points, A and B, are given, the first graph will be represented by linear interpolation.
The second graph gives three points: the polynomial is quadratic, etc.

This is illustrated in Fig. 6-11, which shows how first-, second-, third-, and fourth-order polynomials connect two, three, four, and five points, respectively.
What are polynomials?
From the Math is Fun site, the polynomial is composed of two words: poly (meaning “many”) and nominal (in this case, meaning “term”), so it says “many terms.”
A polynomial can have constants, variables, and exponents, but never be divided by a variable.
In the next slide image, the first-degree polynomial comprises two terms: one term is a constant, while the other is a variable. Second-degree and third-degree polynomials are expressed.

What is the leading coefficient for a polynomial?
The leading coefficient of a polynomial is the coefficient with the highest variable degree. Here is the polynomial calculator for the DEGREE AND LEADING COEFFICIENT CALCULATOR.

A solved problem for the leading coefficient and the leading term.
For a given example of f(x)= 5×4+2×3-x+4, the leading coefficient is the coefficient with the highest power. The highest power is 4, and the coefficient of that highest power is 5. The highest term is(5*x4).

What is linear interpolation?
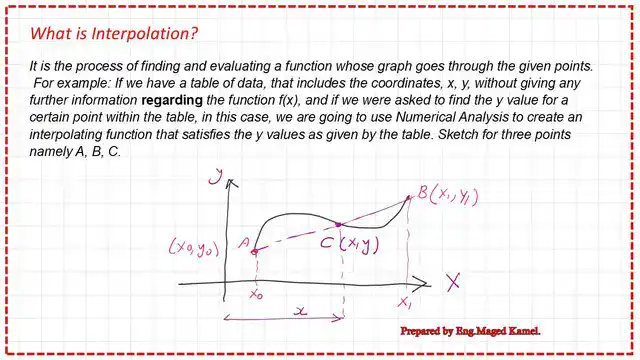
Linear interpolation estimates a missing functional value between two data points by constructing a line between them. The line’s linear function can then be used to find the desired value for the data point of interest.
Using the initial point A, which has a coordinate of (x0,y0), and another point B, with a coordinate of (x1,y1), the line joining the two points can be estimated by estimating its slope as the difference in y divided by the difference in x distance.
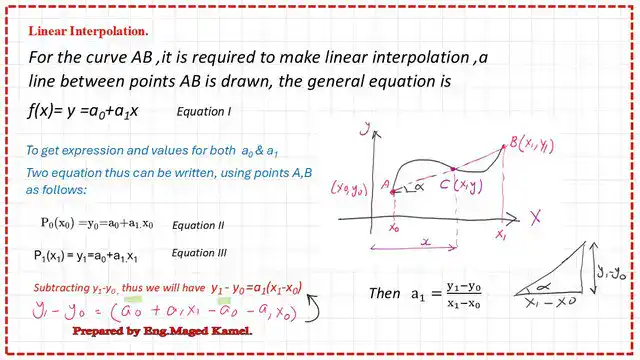
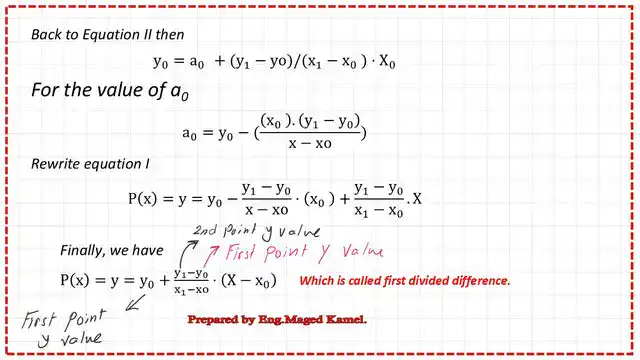
The final form of the polynomial used for the linear interpolation can be written as P(x)=y=y0+((y1-y0)*(x-x0)/(x1-x0).
Then, we will substitute the given values of points A and B. Thus, we get the final equations for x and y.
Solved example#1.
To obtain a linear interpolation of f(x) = sqrt(x), we require two points: point 1, with coordinates (1,1), and point 2, with coordinates (9,3).
We will substitute in the equation of the P(x)=y=y0+((y1-y0)*(x-x0)/(x1-x0). for x0=1, y0=1 and (x1=9, y1=3), thus we can get the final polynomial equation as a linear interpolation.
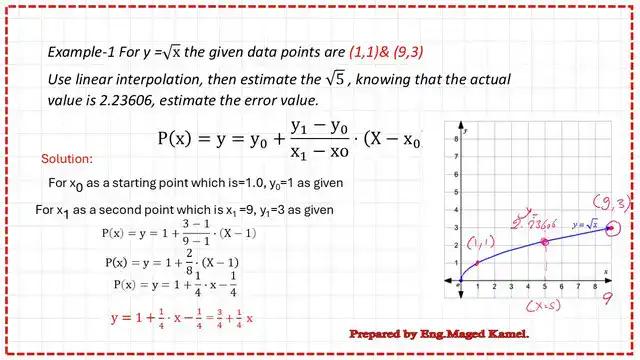
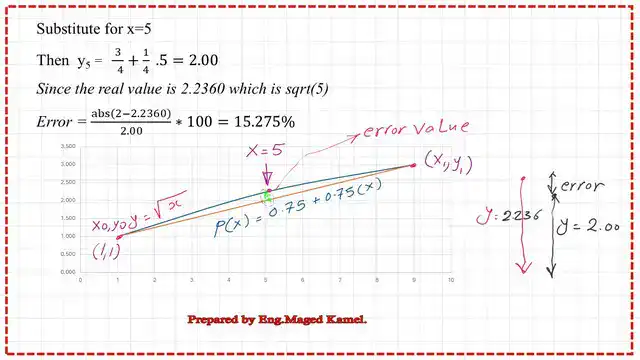
For point c, where x = 5, we can set P(5) to 2.00. For F(x) as the square root of 5, it will equal =2.236. We can estimate the error between the original and linear interpolation functions. A graph is drawn to show the difference between the two functions.
The PDF containing this post’s content can be viewed or downloaded from the following link.
The next post is post 2a- an Easy introduction to quadratic interpolation.
This is an excellent resource for the background of interpolation.
Linearinterpolation calculator tool.