A Solved problem for EAW/ Equivalent Annual Worth.
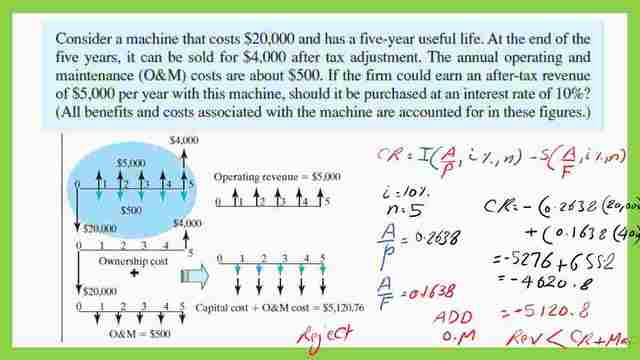
From our last post, we have considered a machine that costs $20,000. The salvage value is $4000 which Has revenue of $5000 yearly for the next five years, while the operation cost and maintenance are $500 annually for the next five years.
We have converted the Initial investment and the salvage to annual Cost or CR. And then, we added the Cost of operation and maintenance. The sum is $5120.76, and the Revenue value is $5000. We have concluded that this investment will lead to a loss.
What is the relation between EAB, EAC, and EAW?
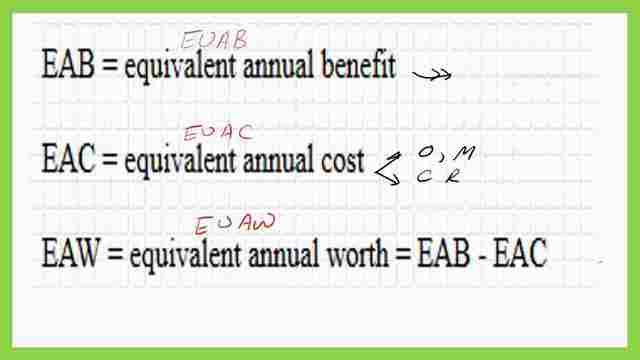
In the next slide, there are three expressions. We will introduce a definition for EAB-EAC-EAW. The first item EAB or sometimes written as EUAB stands for the equivalent uniform annual benefits.
EUAB is the revenue you earn from operating a machine or the income you earn due to cash in or inflows, and this is represented by a positive sign(+).
The second expression is EAC, sometimes written as EUAC, which represents the equivalent. Uniform Annual Cost. The uniform term expresses that these costs are equal in value and the term Annual means that the Cost is per year and equivalent.
The second expression is EAC, sometimes written as EUAC, which represents the equivalent. Uniform Annual Cost. The uniform term expresses that these costs are equal in value and the term Annual means that the Cost is per year and equivalent.
EAC we obtain from two sources; the first source is from the Capital recovery that we have expressed.
The second source is the Cost of operation and maintenance sources. Both sources we represented by downward arrows with negative (-) signs.
The Third expression EAW or EUAW or the equivalent uniform annual worth=EAB-EAC Or EUAB-EUAC will lead to a positive profit value.
If the difference is positive, this will indicate that you have a good investment. If the difference is negative, this will indicate that EUAC is bigger than EUAB, this will conclude that costs are higher than benefits and the investment is not profitable.
A solved problem for EAW or the Equivalent Annual Worth.
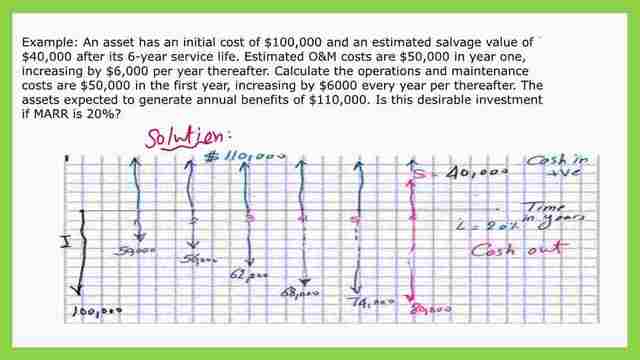
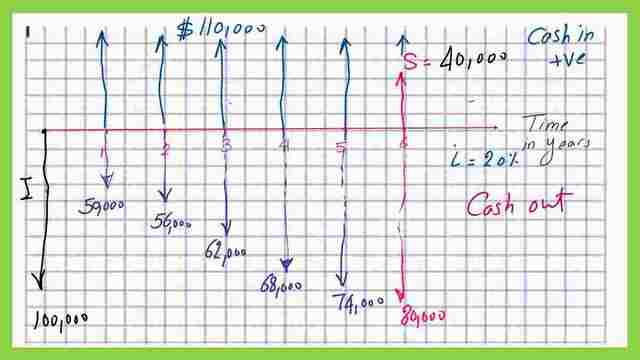
We will have a solved problem for EAW or the Equivalent Annual Worth. An asset has an initial cost of $100,000 and an estimated salvage value of $40,000 after its 6-year service life.
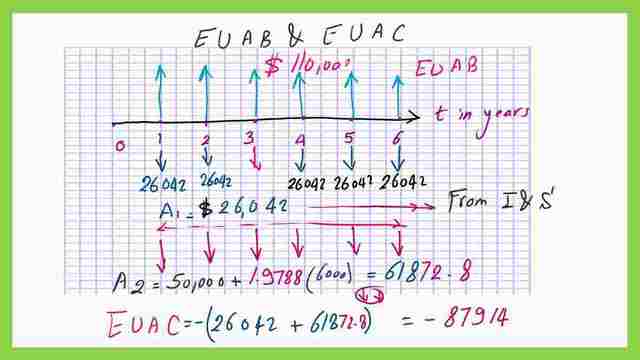
I draw a time scale from t=0 to t=6 years. Estimated O&M costs are $50,000 in year one, increasing by $6,000 per year after that.
We have an item to consider, which is the uniform gradient. The start value is $50,000, G Gradient value of $6000 is added at the end of each year from year one to year 6.
The initial value is $50,000, at the end of year two we have $56000, then $62000 at the end of year 3, followed by 68000,74000 and finally $80,000.
The increase is the Gradient value G. G value is $6000. The assets are expected to generate annual benefits of $110,000. This is $110,000 represented as upward arrows in the time scale during the next six years from t=1 to t=6. Is this a desirable investment if MARR is 20%? how can we judge or decide on this investment? This is done by using the Annual Equivalent Cost.
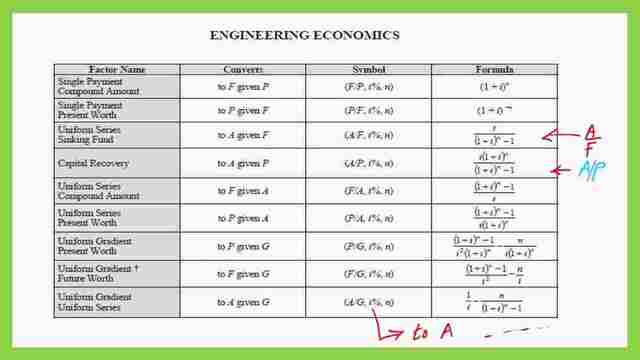
It is important to convert the costs, in the solved problem, whether initial cost or final to annual cost. That is why we will use the conversion table relations. Using the table for the relation between A/F& A/P and G/A.
How to estimate EAC?
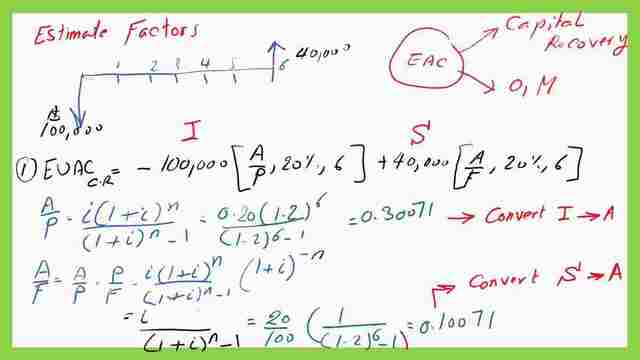
In the next slide, of the solved problem, the EAC is composed of two items; the first one is capital recovery, and the second one is operation and maintenance. I will estimate one by one. The Capital recovery CR can be calculated from the initial cost, which is -100,000, and the salvage value S of 40,000.
For the first estimate, we have- 100,000*(A/P, MARR=20%,n=6 years). The slide image shows both the cash-in and cash-out diagram with the years from t=0 to t=6.
The second term is+40,000*(A/F,20%,6). If we do not have the table, we will use the conversion equations. A/P=(i)*(i+i)^n/(1+i)^n-1, for i=20%, we can get the value of A/p as equals (20*1/100)*(1+0.20)^6/(1+0.20)^(6-1)=0.300071. For A/F, it is (A/P)*(P/F)= From the Previous relation of A/P and then multiplied by (1+i)^n. The final value of A/F=i/(1+i)^n-1. A/F=0.20/(1+0.20)^6-1=0.1007. I have completed the estimate for the capital recovery.
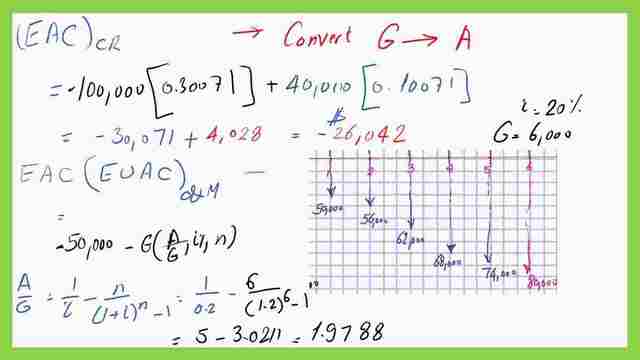
In the next slide, for EAC for CR=-100,000(0.30071)+ 40,000(010071). EAC=-26,042. For the estimate of EAC for operation and maintenance. We have an annual gradient cost, the initial value=$50,000, and the G value=6000.
I
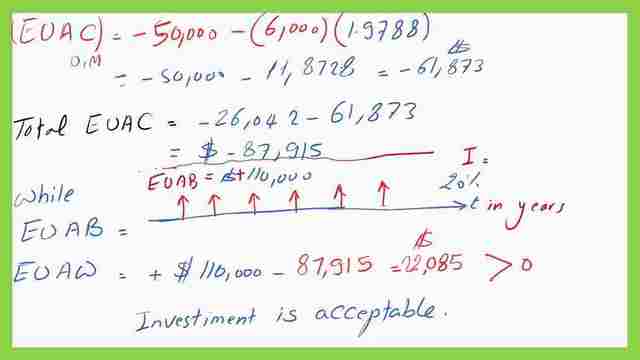
The annual gradient cost can be estimated as =-50,000, will be left unchanged drawn as downward arrows,+(- G(A/G,i=20%,6). A/G=(1/i)-((n/(1+i)^n)-1)). i=20%, then A/G=(1/0.20)-((6/(1.20)^6-1))=1.9788.
In the next slide, The total value of EAC for operation and maintenance, EUAC, is the sum of -87.715. The last step is to calculate EUAB, which is easy to calculate since its data is given as $110,000 distributed each for the next six years. The last equation is EUAW or the equivalent annual worth =EUAB -EUAC=110,000-87,915=22,085. This investment causes profit since the difference is more than zero, and the investment is acceptable.
The same procedure is done for the solution.
The pdf used for the illustration of this post can be downloaded from this link.
The next post will give an introduction to the different types of Assets.
For a useful external resource, Engineering Economy. Applying Theory to Practice.