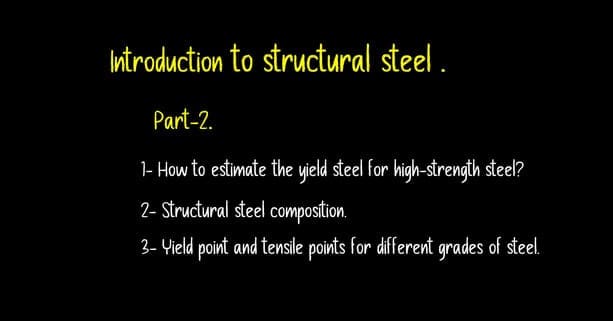
Easy approach to Stress strain relationship.
The ensuing details will be covered as follows:
1-Steel’s stress-strain relationship.
2-The various regions observed from the Stress-strain relationship for steel.
3-How can the steel stress-strain relationship be used to calculate the yield stress?
4-The different steel grades and their graphs.
5-The various grades of steel and their graphs.
Stress-strain relationship for steel.
The second lecture on the introduction of structural steel is being given today. We’ll talk about the link between stress and strain in structural steel. when a section of structural steel that is ductile is pulled taut.
That load will cause the piece’s length to rise. The elongation will grow linearly as long as the tensile force rises at a consistent rate.
For example, when the tension increases from 6000 psi to 12000 psi (pound per square inch), the elongation will quadruple. The elongation starts to develop faster without a matching increase in stress as the tensile stress approaches approximately 3/4 of the steel’s maximum strength.

The graph between stress and strain.
We are having a discussion about this piece of steel. The cross-section of the piece is A. f=P/A is the stress equation, while ε=ΔL/L is the elongation. and f is the axial tensile tension. The area of cross-section is denoted by (A).
ε stands for axial strain, L for specimen length, and ΔL for length change. A graph with the stress shown as a vertical axis and the strain displayed as an x-axis shows the relationship between stress and strain.
The stress f is estimated using the preceding equation, f=P/A. The elastic modulus of elasticity, or E, is shown by the inclination line. The line stretches until there is an increase in stress as the load increases.
Any increase in stress will eventually be accompanied by a significant increase in strain as loads rise, starting with a slight increase in strain. We have arrived at point A.
Later Until the ultimate tensile strength is reached, any increase in load will increase both stress and strain. Until the fracture point, the stress will decrease with a noticeable rise in strain. The proportionate bounds are the graph’s main points.
The Lower yield point is the other point.
The ultimate tensile strength point is the third point, and the fracture point is the last.
The various regions observed from the Stress-strain relationship for steel.
Four zones may be recognized on the graph. The specimen will return to its initial length in the first region, which is the elastic region, once the load is removed. However, for the other areas. A permanent elongation will occur. The plastic zone is the second, stress hardening is the third, and necking and failure are the final regions.

The different data for the modules of Elasticity and the various regions are also shown in this graph.
How to get the yield stress for a specimen?
How can one find a specimen’s yield stress? There are two approaches. The first one involves choosing a strain of 0.20%, or 0.002, inch/inch.
When the dotted line crosses the graph at a location, the stress is regarded as Fy at 0.2% strain. The dotted line is initially offset from the original straight line.
Building a vertical line at a strain of 0.005 inches/inch or 0.5% inch/inch is the second technique. the point where the graph and the intersection meet. When the stress is 0.5% inch/inch, it is regarded as Fy. When we have a high-strength steel specimen, we perform this technique.

So Fy can be determined either based on 0.20% strain or can be based on 0.50% strain. This is a typical plot for a tensile test.

The structural steel composition and the steel grades for structural steel.
The composition of structural steel as well as the steel grades for structural steel are shown in the upcoming slide.
The composition of two well-known steel grades, ASTM A-572 and ASTM A-36, is as follows.
The table below illustrates the variations in carbon, manganese, phosphorus, sulfur, and silicone between the two structural steel classes.
The different steel grades are displayed in the first column. The density of ASMA-A36 is 7800 kg/m3, or 0.028 lb/cu in. Young’s modulus of elasticity for A36 is always calculated using the value of 200 GPA, or 29,000,000 psi. The Pascal is N /m^2, and the Giga is 10^9.
The lateral strain/longitudinal strain = 0.20 is the Poisson’s ratio. An elongation will result from the tensile force, but it will also cause compressive strain in the perpendicular direction = 0.20.

The different curves for steel grades.
The following graph, which starts with ASTM-A-36, which indicates a yield stress of 36 ksi. The ASTM-A-572 high strength low alloy carbon steel with a yield stress of 50 ksi is shown by the second curve.
For heat-treated construction alloy ASTM-A-514, quenched and tempered alloy steel, there is an additional curve where the yield stress hits 100 ksi. On the basis of 0.20% inch/inch strain, the Fy is estimated. strain of 0.20% inch/inch. The modulus of elasticity shared by all prior steel grades is 29,000 ksi.
The relationship between the yield point and the various steel grades is displayed in the lower table.
For A36 the yield point=36 ksi and the tensile point ranges from 58-80 ksi. For A572 the yield point=42-65 ksi, and the tensile point is from 0.5-0.70%, 50 ksi-70 ksi.
For A514 the tensile point is from 110-130 ksi. The carbon steel types are shown in the slide image. For the ASTM. We are starting with ASTM-A36 for structural shapes and plates. The High strength of alloy steel. The grade starts with A441 for structural shapes and plates and then A572.

This is a link for the PDF data used for this post, you can view or download the data.
The next new subject will be the different structural steel shapes, and the related weights will be discussed.
if you want to see the major changes between Cm#14 and CM#15 regarding the different grades of steel and their uses for steel elements and bars please refer to post 1A.
A very good reference is A Beginner’s Guide to Structural Engineering.